When working with relational data across different sheets or tables, retrieving matching information manually is nearly impossible. For decades, VLOOKUP has been the industry-standard function for cross-referencing data in Excel.
However, Microsoft introduced XLOOKUP in modern versions of Excel to address long-standing limitations of VLOOKUP. In this guide, we cover how VLOOKUP works step-by-step, common errors to avoid, and why transitioning to XLOOKUP will save you hours of work.
💼 Real-World Scenario: When Do You Need Lookup Functions?
Suppose you have an Employee ID list in Sheet A and a master Salary Database in Sheet B. Instead of searching each Employee ID manually, a lookup formula searches the ID in Sheet B and automatically retrieves the corresponding salary into Sheet A.
🔍 Part 1: How VLOOKUP Works (Step-by-Step)
VLOOKUP stands for Vertical Lookup. It searches for a specific value in the first column of a table and returns a value in the same row from a specified column to the right.
Analyzing thousands of rows of raw transactional data manually is time-consuming and prone to human error. Pivot Tables are one of Excel’s most powerful built-in tools, allowing you to summarize, aggregate, and explore massive datasets in just a few clicks—without writing a single formula.
In this step-by-step guide, we will walk through how to build a Pivot Table from scratch, apply key filters, and troubleshoot common formatting issues.
💼 Real-World Scenario: Why Use a Pivot Table?
Imagine you have a sales log containing 5,000 rows with columns for Date, Region, Sales Rep, Product, and Revenue.
Without Pivot Tables: You would need to use complex SUMIFS or COUNTIFS formulas to calculate total revenue per region or per sales rep.
With Pivot Tables: You simply drag and drop fields into four distinct areas to instantly calculate totals, averages, and percentage breakdowns.
🛠️ Step 1: Preparing Your Source Data
Before inserting a Pivot Table, ensure your source dataset adheres to these 3 strict rules:
Unique Column Headers: Every column must have a clear, non-blank header name in the top row.
No Empty Rows or Columns: Ensure there are no completely blank rows or columns splitting your dataset.
No Merged Cells: Unmerge all merged cells within the data range.
💡 Pro Tip: Convert your raw data range into an official Excel Table (Ctrl + T) before creating a Pivot Table. This ensures that any new rows added later will automatically be included when you refresh the Pivot Table!
🚀 Step 2: Creating the Pivot Table
Click any single cell inside your data dataset.
Go to the Insert tab on the ribbon menu and click PivotTable.
In the pop-up dialog, verify that your data range is selected correctly.
Choose New Worksheet as the destination and click OK.
🧭 Step 3: Understanding the 4 Pivot Table Fields
A new worksheet will open with an empty Pivot Table grid on the left and the PivotTable Fields pane on the right. You can drag your column names into four areas:
Area
Purpose
Example Usage
Filters
Restricts top-level data across the entire table
Filter by Year or Status
Columns
Displays selected field values across horizontal headers
By default, Pivot Tables display unformatted numbers (e.g., 1250000). To apply currency or thousands commas cleanly across the entire summarized field:
Right-click any numeric cell inside the Pivot Table values.
Select Number Format… (Do NOT choose Format Cells).
Select Number or Currency, check Use 1000 Separator (,), and click OK.
⚠️ Troubleshooting Common Pivot Table Errors
1. Values Display as “Count of Revenue” Instead of “Sum of Revenue”
Cause: Your source data column contains at least one blank cell or text entry.
Solution: Right-click the header ➔ Select Summarize Values By ➔ Change from Count to Sum.
2. New Data Added to Source Range Does Not Appear
Cause: Pivot Tables do not auto-refresh when source data changes.
Solution: Right-click inside the Pivot Table and click Refresh (or press Alt + F5).
Conclusion
Pivot Tables transform raw transactional logs into actionable business summaries within seconds. Mastering drag-and-drop fields and numeric formatting will elevate your analytical capability immediately.
In our next guide, we will explore Excel VLOOKUP Function Guide: Basic Usage and XLOOKUP Comparison to master cross-referencing data across multiple tables!
Have you ever typed a date into Excel only to see it turn into a strange number like 45442? Or spent extra time manually typing currency symbols or units like “USD”, “pcs”, or “lbs” next to every number?
All these issues can be resolved in seconds once you understand Cell Formatting using the shortcut Ctrl + 1. In this guide, we cover 3 essential cell formatting techniques every Excel user should know.
1. Apply Thousands Separators (,) and Currency Formats
Large numbers without commas are difficult to read. You can format numbers cleanly in just a few clicks.
Select the range of cells containing the numbers.
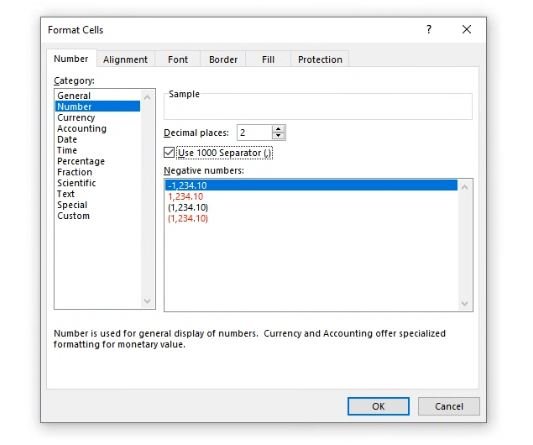
Press Ctrl + 1 to open the Format Cells dialog box.
Navigate to [Number] ➔ [Number] in the Category menu.
Check the box for ‘Use 1000 Separator (,)’ and click OK.
💡 Quick Tip: You can also click the Comma Style (,) button directly in the Home tab on the ribbon menu!
2. Append Custom Units (“USD”, “pcs”, “items”) Automatically
If you manually type text alongside numbers in a cell (e.g., 100 pcs), Excel treats the cell as Text, which prevents functions like SUM or AVERAGE from calculating properly!
To keep numeric properties intact for calculations while displaying custom units on screen, use Custom Formatting:
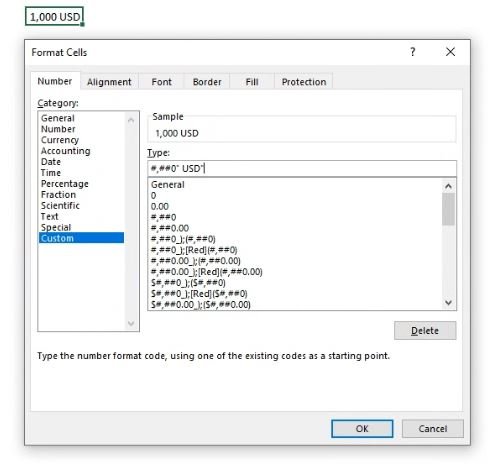
Press Ctrl + 1 ➔ Go to [Number] tab ➔ Click [Custom].
In the Type input box on the right, enter one of these formatting codes:
#,##0" USD" ➔ Formats with thousands commas and appends ‘USD’ (e.g., 1,000,000 USD)
#,##0" pcs" ➔ Appends quantity units (e.g., 50 pcs)
0000 ➔ Pads leading zeros to match a fixed digit length (e.g., entering 5 displays as 0005)
3. Fix Corrupted or Numeric Date Displays
When entering dates, you might occasionally see raw serial numbers like 46225 instead of 2026-07-22. This happens because Excel calculates dates as sequential serial numbers starting from January 1, 1900.
How to Fix: Select the cells ➔ Press Ctrl + 1 ➔ Choose [Date] ➔ Select your preferred date format (e.g., YYYY-MM-DD or MM/DD/YYYY).
📊 High-Yield Custom Formatting Codes for Daily Use
Raw Data
Custom Format Code
Displayed Result
Practical Description
1234567
#,##0
1,234,567
Standard thousands separator
1234567
#,##0" USD"
1,234,567 USD
Thousands separator + currency suffix
50
#,##0" pcs"
50 pcs
Quantity suffix (retains formula usability)
20260722
0000-00-00
2026-07-22
Formats 8-digit numbers as standard dates
Conclusion
Mastering Cell Formatting dramatically improves data readability and prevents formula errors before they happen.
This concludes our essential Basics series (Shortcuts, Formulas, and Formatting)!
Starting with our next post, we will move into the Tools category to explore powerful productivity features: Pivot Tables and VLOOKUP / XLOOKUP functions.
Building on our previous guide on essential Excel shortcuts, today we cover the 5 fundamental Excel formulas that form the backbone of all data calculations.
Without needing complex conditional logic or nested arguments, mastering these five basic functions will allow you to handle 90% of daily data aggregation tasks with ease.
1. SUM ➔ Calculate total sums instantly
The most basic and frequently used function in Excel.
Syntax:=SUM(range)
Example:=SUM(C2:C10) ➔ Calculates the total sum of numbers from cell C2 through C10.
💡 Pro Tip: Press Alt + = to automatically select the range and insert the SUM formula in less than a second.
2. AVERAGE ➔ Compute arithmetic means
Calculates the average value of a given set of numbers.
Syntax:=AVERAGE(range)
Example:=AVERAGE(D2:D10) ➔ Calculates the average of the values in the range.
⚠️ Note: Blank cells are ignored automatically, but cells containing a numeric 0 are included in the average calculation.
3. COUNT / COUNTA ➔ Count data entries
Used to count the number of cells containing data within a specified range.
COUNT (Numbers only):=COUNT(range)
Counts only the cells containing numerical values.
COUNTA (Non-empty cells):=COUNTA(range)
Counts all non-blank cells (including text, numbers, and symbols).
4. MAX & MIN ➔ Identify highest and lowest values
Quickly extract extreme values from large datasets.
Maximum (MAX):=MAX(range) ➔ Returns the largest numerical value in the range.
Minimum (MIN):=MIN(range) ➔ Returns the smallest numerical value in the range.
Practical Use: Excellent for identifying peak sales performance or minimum cost items instantly.
📊 Essential Formulas Summary Table
Function
Primary Purpose
Example Syntax
Key Usage Tip
SUM
Calculate Total
=SUM(A1:A10)
Use shortcut Alt + =
AVERAGE
Calculate Mean
=AVERAGE(A1:A10)
Watch out for 0 values
COUNT
Count Numbers
=COUNT(A1:A10)
Ignores text cells
COUNTA
Count All Entries
=COUNTA(A1:A10)
Includes text and values
MAX / MIN
Find Extremes
=MAX(A1:A10)
Best for peak/lowest metrics
❓ Troubleshooting: When formulas don’t calculate
If you typed a formula correctly but it returns an error or incorrect value, check these two common issues:
Numbers Formatted as Text:
If you see a green triangle in the top-left corner of a cell, Excel treats it as text. Select the range, press Ctrl + 1, and change the format to Number.
Missing Equal Sign (=):
Every Excel formula must start with an equal sign (=) for Excel to process it as a function.
Conclusion
Mastering these five basic functions will streamline your basic reporting and data entry tasks.
In our next guide, we will cover Mastering Excel Cell Formatting (Ctrl + 1) to resolve common display issues like broken date formats and adding currency symbols automatically!
If you are just starting out with Microsoft Excel, mastering a few frequently used keyboard shortcuts is far more effective than trying to memorize complex formulas right away.
In this guide, we skip complicated key combinations and organize the top 10 must-know Excel shortcuts in a logical order—moving from the easiest single-key commands to practical multi-key combinations.
🟢 Level 1: Super Easy Shortcuts (Beginner Level)
These straightforward shortcuts follow intuitive logic, allowing you to apply them to your daily workflow immediately.
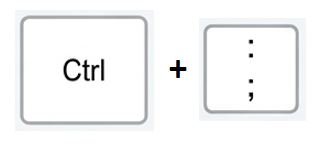
1. Ctrl + ; ➔ Insert Today’s Date Instantly
Frequency: ★★★★★
Description: Pressing the semicolon (;) with Ctrl immediately stamps today’s date into the active cell. No need to type out dates manually when creating daily reports or logs.
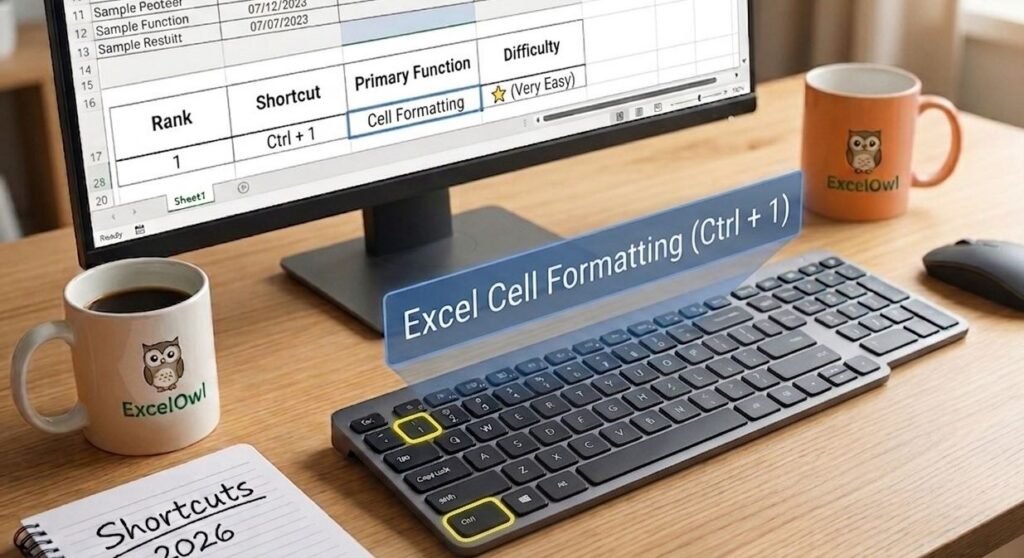
2. Ctrl + 1 ➔ Open Format Cells Window
Frequency: ★★★★★
Description: Just remember the number ‘1’! This shortcut opens the Format Cells dialog far quicker than right-clicking with your mouse—ideal for adjusting borders, number formats, or cell colors.
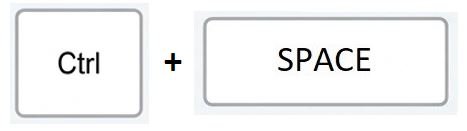
3. Ctrl + Space ➔ Select Entire Column
Frequency: ★★★★☆
Description: Instantly selects the entire vertical column where your cursor is currently located.
4. Shift + Space ➔ Select Entire Row
Frequency: ★★★★☆
Description: While Ctrl handles columns, Shift controls rows. Memorize these two as a pair to quickly move or delete full data rows.
🟡 Level 2: Work Efficiency Boosters (Two-Key Combos)
Eliminate repetitive clicking and scrolling with these essential productivity shortcuts.
5. F4 ➔ Repeat Last Action & Toggle Absolute Reference
Frequency: ★★★★★
Description: If you just highlighted a cell in yellow, simply select another cell and press F4 to repeat the action. When editing formulas, it toggles cell references to absolute format ($A$1).
6. Alt + = ➔ AutoSum (SUM Formula)
Frequency: ★★★★★
Description: Since = represents math operations, combining it with Alt prompts Excel to automatically detect adjacent numerical data and insert a SUM formula.
7. Ctrl + Arrow Keys ➔ Jump to Edge of Data Region
Frequency: ★★★★☆
Description: Instead of endlessly scrolling through thousands of rows, jump directly to the last populated row or column in a single keystroke.
🟠 Level 3: Applied Shortcuts for Speed
While these involve three keys, learning them will cut your data management time in half.
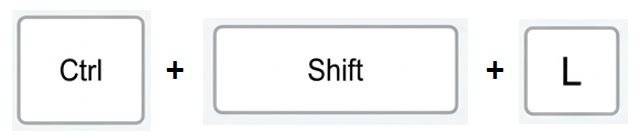
8. Ctrl + Shift + L ➔ Toggle AutoFilter On / Off
Frequency: ★★★★★
Description: Think of ‘L’ as Lock or Filter. Instantly apply or remove filter dropdown arrows across your header row.
9. Ctrl + Shift + Arrow Keys ➔ Select Entire Data Range
Frequency: ★★★★☆
Description: Combines navigation with selection. This shortcut jumps to the end of your dataset while selecting every cell along the way.
10. Ctrl + Alt + V ➔ Open Paste Special
Frequency: ★★★★☆
Description: Used after standard copying (Ctrl+C) to paste values only, keeping formulas intact, or to replicate formatting across cells.
📊 Quick Summary Table
Rank
Primary Function
Windows Shortcut
Difficulty
1
Insert Today’s Date
Ctrl + ;
⭐ (Very Easy)
2
Open Cell Formatting
Ctrl + 1
⭐ (Very Easy)
3
Select Entire Column
Ctrl + Space
⭐ (Very Easy)
4
Select Entire Row
Shift + Space
⭐ (Very Easy)
5
Repeat Action / Lock ($)
F4
⭐ (Easy)
6
Insert AutoSum
Alt + =
⭐ (Easy)
7
Jump to Data Edge
Ctrl + Arrow
⭐ (Easy)
8
Toggle Filters
Ctrl + Shift + L
⭐ (Moderate)
9
Select Full Range
Ctrl + Shift + Arrow
⭐ (Moderate)
10
Open Paste Special
Ctrl + Alt + V
⭐ (Moderate)
Conclusion
Don’t try to memorize all ten shortcuts at once. Start with Level 1 (Shortcuts 1–4) today, and incorporate them into your daily tasks. You will notice an immediate boost in your working speed!
Stay tuned for our next guide on 5 Essential Excel Formulas Every Beginner Must Know (SUM, AVERAGE, COUNT, MAX, MIN).
🍎 Mac & iOS (iPad Keyboard) Equivalents for TOP 10 Shortcuts
If you are using Excel on macOS or an iPad with a Magic Keyboard, use these macOS/iOS key combinations instead:
Rank
Primary Function
Mac / iPad
Difficulty
1
Insert Today’s Date
Cmd (⌘) + ;
⭐ (Very Easy)
2
Open Cell Formatting
Cmd (⌘) + 1
⭐ (Very Easy)
3
Select Entire Column
Ctrl + Space
⭐ (Very Easy)
4
Select Entire Row
Shift + Space
⭐ (Very Easy)
5
Repeat Action / Lock ($)
Cmd (⌘) + T
⭐ (Easy)
6
Insert AutoSum
Cmd + Shift + T(or Option + ⌘ + =)
⭐ (Easy)
7
Jump to Data Edge
Cmd (⌘) + Arrow
⭐ (Easy)
8
Toggle Filters
Cmd (⌘) + Shift + F
⭐ (Moderate)
9
Select Full Range
Cmd (⌘) + Shift + Arrow
⭐ (Moderate)
10
Open Paste Special
Cmd (⌘) + Ctrl + V(or Ctrl + Option + V)
⭐ (Moderate)
💡 Pro Tip for iPad Users: When using Microsoft Excel on an iPad with a Magic Keyboard or external Bluetooth keyboard, press and hold the Cmd (⌘) key for 2 seconds to instantly reveal an on-screen cheat sheet of supported shortcuts!